![]()
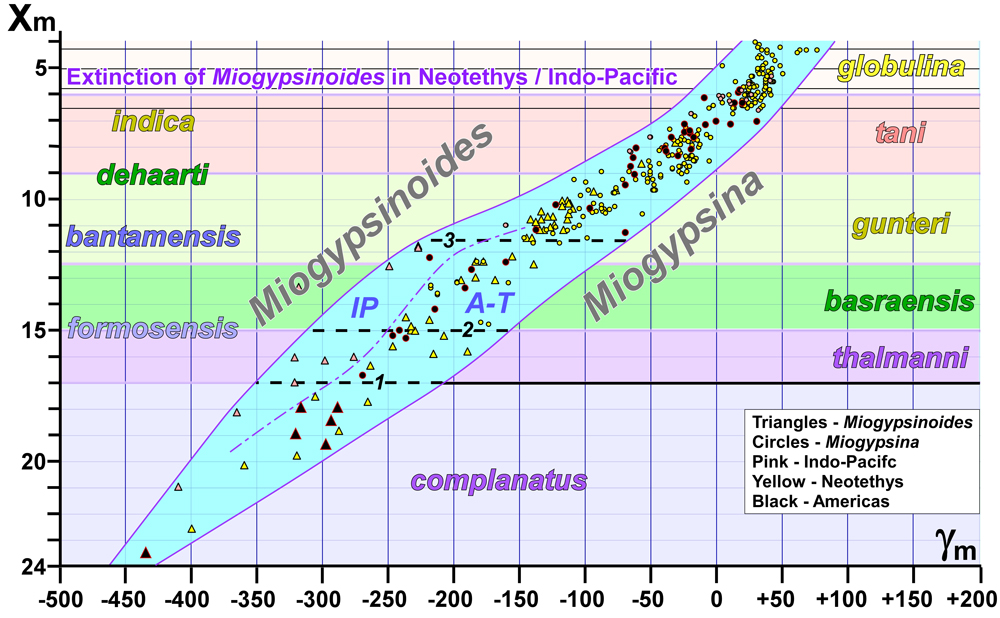
Figure 13: Scatter plot for Xm against γm for populations of uniserial miogypsinids from the Americas, Neotethys, and Indo-Pacific. Note the strong correlation (linear trend) showing that all provinces show a similar type of development with regard to Xm versus γm (but not necessarily at the same time). Note however that Indo-Pacific values plot to the left (lower γm values) compared to Tethys and American Xm values between around 20 and 11. Data from: Drooger, 1954a, 1954b, 1963; Drooger et al., 1955; Drooger & Freudenthal, 1964; Ferrero, 1965, 1987; Soediono, 1969; Cerutti, 1973; Mulder, 1975; Bock, 1976, 1977; Schüttenhelm, 1976; Schiavinotto, 1979, 1985; Delicat & Schiavinotto, 1985; Wildenborg, 1991; Ferrero et al., 1994; Özcan et al., 2010.