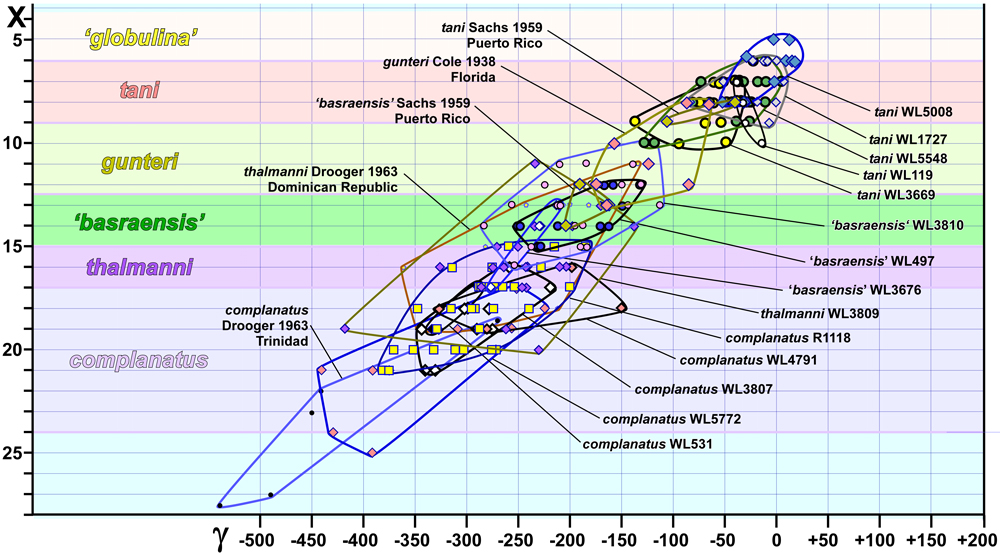
Figure 12: Scatter plot for X against γ for populations of uniserial miogypsinids from the Americas. Note the strong correlation (linear trend). Jamaican samples named on the right, other samples on the left.