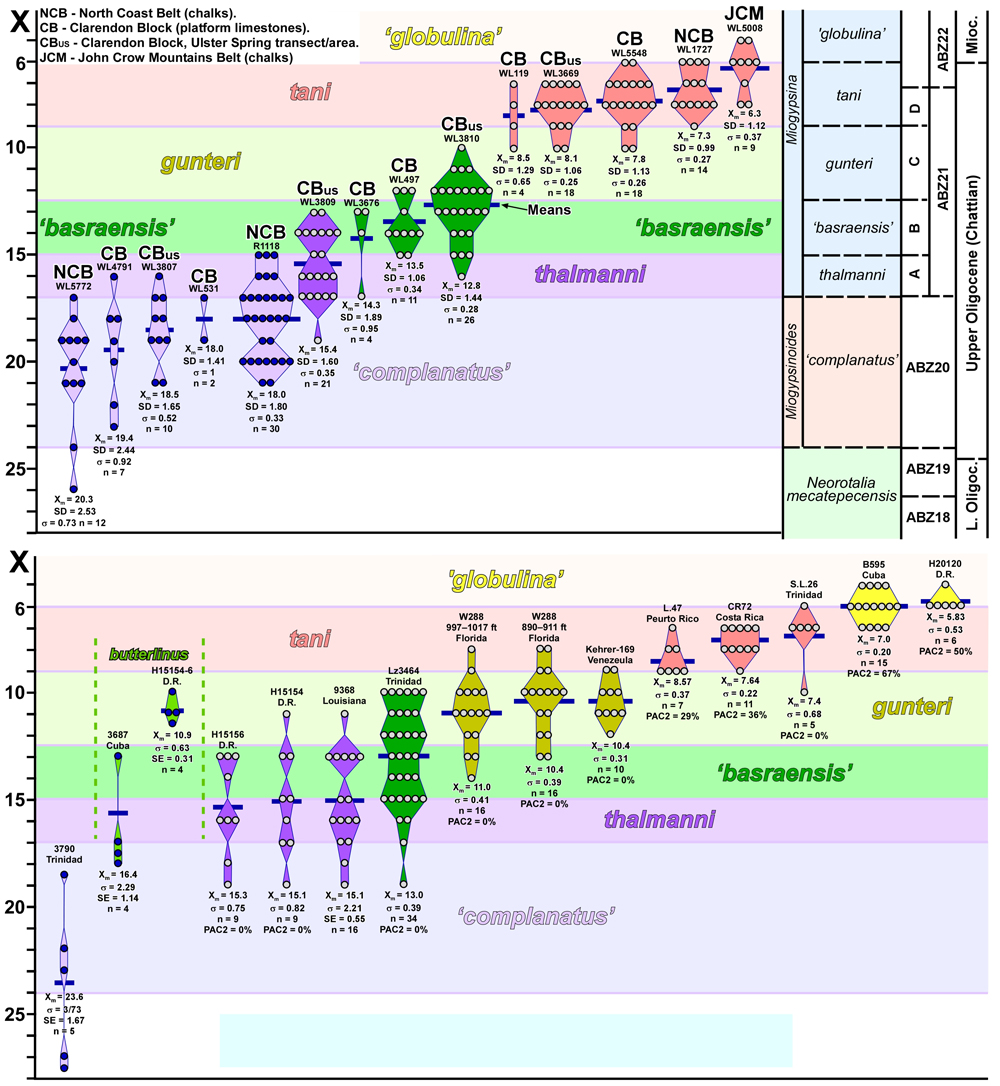
Figure 11: Dot plots (categorical data) for X for populations from Jamaica (upper) and Drooger (Drooger, 1952, 1963; Akers & Drooger, 1957) (lower) arranged by Xm with Jamaican dataset tied to ABZ for the mid to late Oligocene.