
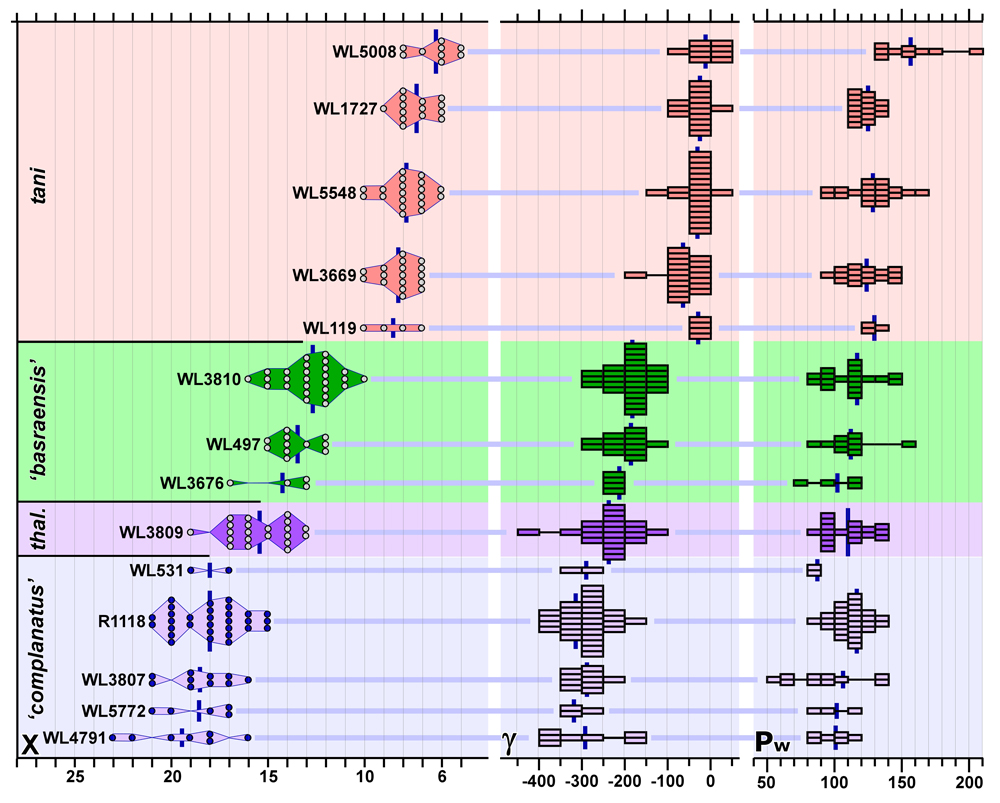
Figure 10: Dot plots (categorical data) for X and bar graphs (for grouped continuous
data) for γ and Pw for populations from Jamaica,
with means (Xm, γm,
and Pwm). X and γ show progressive changes through populations,
whereas Pw shows little systematic change (although a weak overall trend, with
reversals, to higher values is present).