![]()
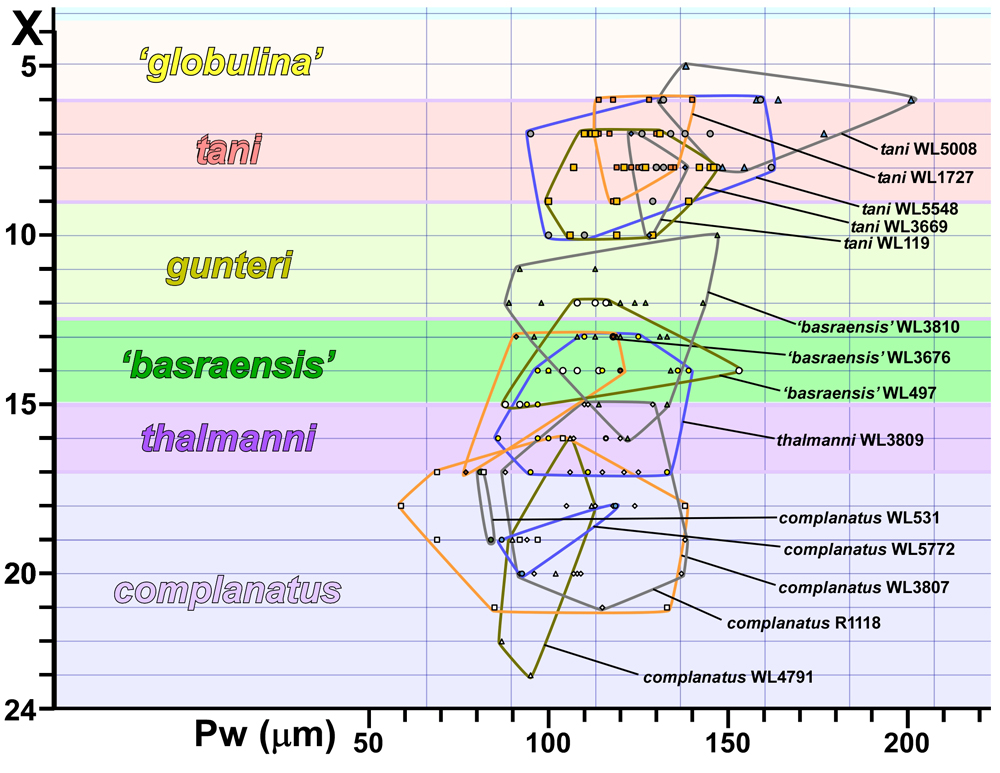
Figure 14: Scatterplot of X versus Pw (in µm) for Jamaican populations of uniserial miogypsinids. Pw shows only a very gradual increase and cannot be used to separate chronospecies. Note that the youngest sample (WL5008), however, has notably higher values.