![]()
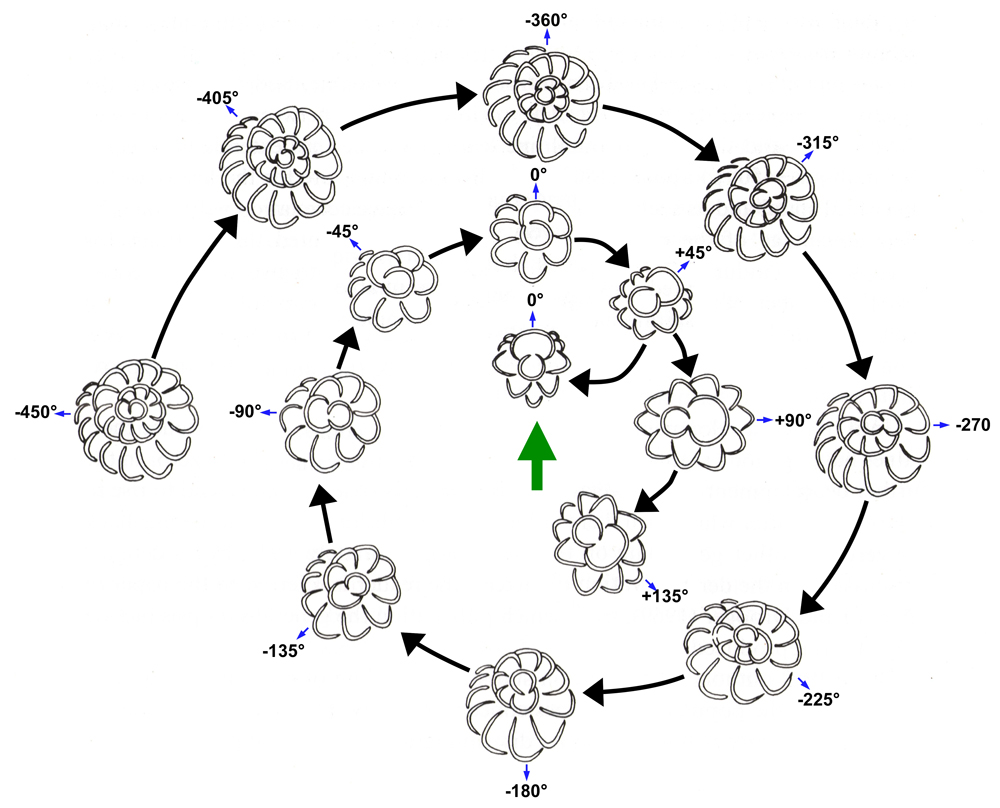
Figure 2: Range of variation of γ in different specimens of miogypsinid foraminfers (revised from Drooger, 1993, Fig. 47). Specimens are arranged with the apical region orientated towards the top (green arrow). The small blue arrow points along the embryonic axis towards the deuteroconch. The black arrows show the evolutionary trend towards less negative γ values and eventually positive γ values.