![]()
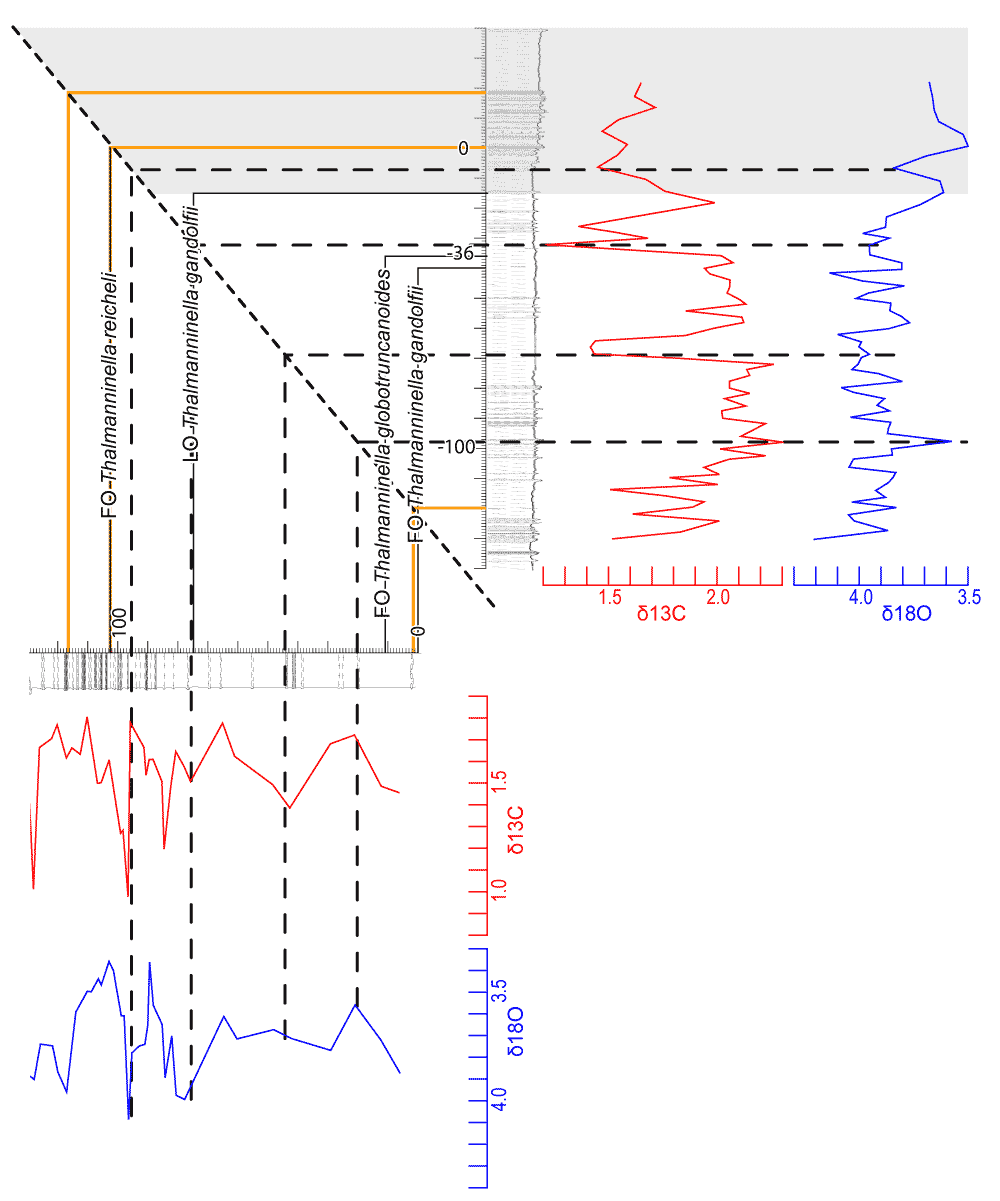
Figure 5:
Graphical
correlation of Moons-Oudet's (2013) and Kennedy's (2004) logs,
represented on the X and Y axes, respectively. Caption: Grey patch = lack of
planktonic foraminifer analyses; orange lines = key lithologic layers; thin
black lines = key biostratigraphic markers; thin dashed blue lines = selected
peaks on the geochemical curves; thick dashed black line = line of correlation.